源码分析 - LeakCanery
使用
- 添加依赖
dependencies { debugImplementation 'com.squareup.leakcanary:leakcanary-android:1.5' releaseImplementation 'com.squareup.leakcanary:leakcanary-android-no-op:1.5' testImplementation 'com.squareup.leakcanary:leakcanary-android-no-op:1.5' } - 在自定义的 Application 中添加
public class MyApplication extends Application { private RefWatcher refWatcher; @Override public void onCreate() { super.onCreate(); if (LeakCanary.isInAnalyzerProcess(this)) { //判断是否是 LeakCanary 专门用于分析 heap 内存而创建的那个过程。 //即 HeapAnalyzerService 所在的进程,如果是的话,则不进行 Application 中的初始化功能 return; } //进行 LeakCanary 的安装。 refWatcher = LeakCanary.install(this); } public static RefWatcher getRefWatcher(Context context) { MyApplication appContext = (MyApplication) context.getApplicationContext(); return appContext.refWatcher; } } - 如果要监听 Fragment 的话
public abstract class BaseFragment extends Fragment {
   public void onDestroy() {
     super.onDestroy();
     RefWatcher refWatcher = MyApplication.getRefWatcher(getActivity());
     refWatcher.watch(this);
   }
}
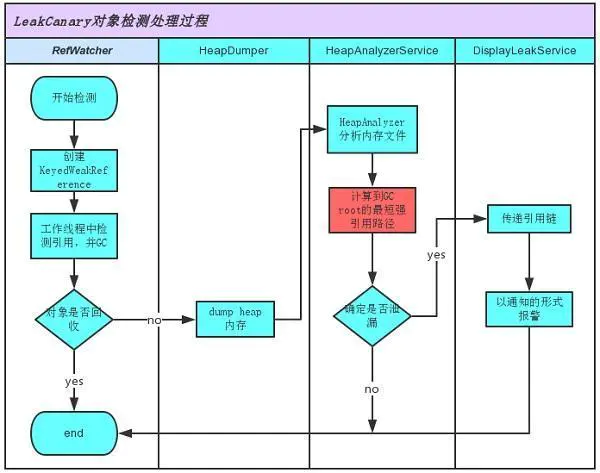
基本原理
执行 Application 中的 registerActivityLifecycleCallbacks() ,从而对应用内 Activity 的生命周期进行监听,而 LeakCanery 就只监听了onDestroy() 当一个 Activity 执行了 onDestory() 之后,那就意味着这个 Activity 已经不存在了, LeakCanery 会将这个 Activity 对象放入到一个 WeakReference 中,然后将这个 WeakReference 类型的对象与 ReferenceQueue 关联,这时候再从 ReferenceQueque 中查看是否是有没有该对象,如果没有,因为有可能还没执行过 GC ,所以手动执行 GC ,再次查看,还是没有的话,则发生了内存泄漏,然后用 HAHA 这个开源库去分析 dump 之后的 heap 内存。
WeakReference 与 ReferenceQueue
如果对象被回收后,会把弱引用对象,也就是 WeakReference 对象或者其子类的对象,放入队列 ReferenceQueue 中。 注意不是被弱引用的对象,被弱引用的对象已经被回收了。例如
WeakReference<Apple> appleWeakReference  = new WeakReference<>(apple);
Apple apple2 = appleWeakReference.get();
- apple 是 被弱引用的对象,
- appleWeakReference 是弱引用对象,
如果 apple 这个对象被回收,则会把 appleWeakReference 放到 ReferenceQueue 这个队列中,如果没有被回收,则不会放到队列中,所以可以通过判断 ReferenceQueue 这个队列中有没有 appleWeakReference 来确定有没有发生内存泄漏
大体步骤分以下七步:
- 通过RefWatcher.watch()创建了一个 KeyedWeakReference 用于观察对象。
- 在后台线程中。 KeyedWeakReference 会检测引用是否被清除了,并且有没有触发GC
- 如果引用没有被清除,那么 KeyedWeakReference 将会把堆栈信息保存在文件系统中的.hporf文件中
- HeapAnalyerService会开启一个独立的进程,并且 HeapAnalyer 使用开源库 HAHA 解析指定时刻的堆栈快照文件heap dump
- 从 heap dump 中, HeapAnalyer 根据一个独特的引用 key 找到 KeyedWalkedReference ,并且定位了泄漏的引用
- HeapAnalyer为了确定是否有引用泄漏,计算了 GC Root 的最短强引用路径,然后建立导致泄漏的引用链
- 这个结果被传递到 APP 进程的 DisplayLeakService ,然后一个泄漏通知便展现出来
来张图吧
源码分析
上面的使用方法可以看出,关键代码就这一句。LeakCanary.install(this),所以我们就从这里进行分析
public static RefWatcher install(Application application) {
return refWatcher(application)// 1
      .listenerServiceClass(DisplayLeakService.class)//2
      .excludedRefs(AndroidExcludedRefs.createAppDefaults().build()) //3
      .buildAndInstall();//4
}
一个链式调用,一步一步的看咯。
1.AndroidRefWatcherBuilder # refWatcher()
public static AndroidRefWatcherBuilder refWatcher(Context context) {
  return new AndroidRefWatcherBuilder(context);
}

public final class AndroidRefWatcherBuilder extends RefWatcherBuilder<AndroidRefWatcherBuilder> {
  private final Context context;

  AndroidRefWatcherBuilder(Context context) {
    this.context = context.getApplicationContext();
  }
  ...
}
注意,这里面的参数是 Application ,它是 APP 的 applicationContext ,一个全局的 Context 。
通过上面代码可以看出 refWatcher() 创建了一个 AndroidRefWatcherBuilder 对象,这个对象保存了传入的 applicationContext 。 AndroidRefWatcherBuilder 继承 RefWatcherBuilder
AndroidRefWatcherBuilder
- AndroidRefWatcherBuilder 是一个适合 Android 平台的引用观察者构造器对象。(难道还有其他平台 IOS ,WindowPhone?)
- RefWatcherBuilder 是一个负责建立引用观察类 RefWatcher 实例的基类
- RefWatcherBuilder 中有一个 HeapDump ,这个就是保存 heap dump 信息的数据结构
接下来看看看这个 listenerServiceClass(DisplayLeakService.class)
2.AndroidRefWatcherBuilder # listenerServiceClass()
public AndroidRefWatcherBuilder listenerServiceClass( Class<? extends AbstractAnalysisResultService> listenerServiceClass) {
    return heapDumpListener(new ServiceHeapDumpListener(context, listenerServiceClass));
  }

public class RefWatcherBuilder<T extends RefWatcherBuilder> {

  public final T heapDumpListener(HeapDump.Listener heapDumpListener) {
    this.heapDumpListener = heapDumpListener;
    return self();
  }
}
这里面的参数 是 DisplayLeakService.class,也就是 DisplayLeakService 的字节码对象。然后新建了一个 ServiceHeapDumpListener 对象, 里面保存了 DisplayLeakService 的 class 对象和 Application 对象,
这里面出现了两个新的类,先大概介绍一下。
- DisplayLeakService 这个用于展示泄漏分析日志的结果信息,然后发送通知用户
- ServiceHeapDumpListener 里面保存了 DisplayLeakService 的 class 对象和 Application 对象,作用就是接收一个 heap dump 文件去分析。
所以这一步的操作就是创建了一个用于分析 heap dump 文件的 ServiceHeapDumpListener ,并设置到 RefWatcherBuilder 。
继续看步骤3 excludedRefs(AndroidExcludedRefs.createAppDefaults().build())
3. RefWatcherBuilder # excludedRefs()
这个信息量有点大啊,先一点点看吧
3.1 AndroidExcludedRefs.createAppDefaults()
public static ExcludedRefs.Builder createAppDefaults() {
    return createBuilder(EnumSet.allOf(AndroidExcludedRefs.class));
  }
AndroidExcludedRefs 是一个枚举类,声明了 Android SDK 和厂商定制的 SDK 中存在的泄漏的 case ,这些 case 都会被 LeakCanary 过滤掉。
EnumSet.allOf(AndroidExcludedRefs.class) 返回一个包含 AndroidExcludedRefs 类型的 EnumSet
3.1.1 EnumSet.allOf()
EnumSet 是一个抽象类,具体的实现类是通用正规型的RegularEnumSet
//EnumSet.java
public static <E extends Enum<E>> EnumSet<E> allOf(Class<E> elementType) {
   EnumSet<E> result = noneOf(elementType);
   result.addAll();
   return result;
}

public static <E extends Enum<E>> EnumSet<E> noneOf(Class<E> elementType) {
   Enum<?>[] universe = getUniverse(elementType);
   if (universe == null)
       throw new ClassCastException(elementType + " not an enum");

   if (universe.length <= 64)
       return new RegularEnumSet<>(elementType, universe);
   else
        //用于存储大量数据 JumboEnumSet
       return new JumboEnumSet<>(elementType, universe);
}
AndroidExcludedRefs 中目前有 46 种 case ,所以返回的是 RegularEnumSet ,
也就是说 createBuilder() 中的参数 是 RegularEnumSet 类型的。
3.1.2 AndroidExcludedRefs # createBuilder()
public static ExcludedRefs.Builder createBuilder(EnumSet<AndroidExcludedRefs> refs) {
  ExcludedRefs.Builder excluded = ExcludedRefs.builder();
  for (AndroidExcludedRefs ref : refs) {
    if (ref.applies) {
      ref.add(excluded);
      ((ExcludedRefs.BuilderWithParams) excluded).named(ref.name());
    }
  }
  return excluded;
}
构建一个排除引用的构造器 excluded ,将各式各样的 case 分门别类保存,再返回出去。
所以这一步的主要操作就是添加白名单, AndroidExcludedRefs 定义了忽略列表信息。如果发送这些内存泄漏,并不会显示出来的。
继续看步骤4 buildAndInstall()
4. AndroidRefWatcherBuilder # buildAndInstall()
这里面主要是创建一个 RefWatcher 对象,并返回,这个对象就是用于检测对象是未否被回收导致内存泄漏
public RefWatcher buildAndInstall() {
  // 4.1  调用 build() 方法创建一个RefWatcher
    RefWatcher refWatcher = build();
    if (refWatcher != DISABLED) {
      // 4.2
      LeakCanary.enableDisplayLeakActivity(context);
      //4.3
      ActivityRefWatcher.installOnIcsPlus((Application) context, refWatcher);
    }
    return refWatcher;
  }
先看 4.1 build() 方法吧
4.1 AndroidRefWatcherBuilder # build()
public final RefWatcher build() {
    if (isDisabled()) {
      return RefWatcher.DISABLED;
    }
    //excludedRefs 记录可以被忽略的泄漏路径
    ExcludedRefs excludedRefs = this.excludedRefs;
    if (excludedRefs == null) {
      excludedRefs = defaultExcludedRefs();
    }
    //heapDumpListener 转储堆信息到 hprof 文件,并在解析完 hprof 文件后进行回调,最后通知 DisplayLeakService 弹出泄漏提醒
    HeapDump.Listener heapDumpListener = this.heapDumpListener;
    if (heapDumpListener == null) {
      heapDumpListener = defaultHeapDumpListener();
    }
    //debuggerControl : 判断是否处于调试模式,调试模式中不会进行内存泄漏检测。为什么呢?因为在调试过程中可能会保留上一个引用从而导致错误信息上报。
    DebuggerControl debuggerControl = this.debuggerControl;
    if (debuggerControl == null) {
      debuggerControl = defaultDebuggerControl();
    }
    //heapDumper : 堆信息转储者, dump 内存泄漏处的 heap 信息到 hprof 文件
    HeapDumper heapDumper = this.heapDumper;
    if (heapDumper == null) {
      heapDumper = defaultHeapDumper();
    }
    //watchExecutor : 线程控制器,在 onDestroy() 之后并且主线程空闲时执行内存泄漏检测
    WatchExecutor watchExecutor = this.watchExecutor;
    if (watchExecutor == null) {
      watchExecutor = defaultWatchExecutor();
    }
    //gcTrigger : 用于 GC , watchExecutor 首次检测到可能的内存泄漏,会主动进行 GC , GC 之后会再检测一次,仍然泄漏的判定为内存泄漏,最后根据 heapDump 信息生成相应的泄漏引用链。
    GcTrigger gcTrigger = this.gcTrigger;
    if (gcTrigger == null) {
      gcTrigger = defaultGcTrigger();
    }
    return new RefWatcher(watchExecutor, debuggerControl , gcTrigger , heapDumper , heapDumpListener ,excludedRefs);
  }
使用建造者模式,把这些组成部分构建成一个新的 RefWatcher ,然后返回。
然后继续看 4.2 enableDisplayLeakActivity()
4.2 LeakCanary # enableDisplayLeakActivity()
import static com.squareup.leakcanary.internal.LeakCanaryInternals.setEnabled;

public static void enableDisplayLeakActivity(Context context) {
    setEnabled(context, DisplayLeakActivity.class, true);
  }
setEnabled() 是一个静态导入,在 LeakCanaryInternals 这个类中的
//LeakCanaryInternals.java
public static void setEnabled(Context context, final Class<?> componentClass,final boolean enabled) {
  final Context appContext = context.getApplicationContext();
  executeOnFileIoThread(new Runnable() {//4.2.1
    @Override public void run() {
      setEnabledBlocking(appContext, componentClass , enabled);//4.2.2
    }
  });
}
先看 4.2.1 executeOnFileIoThread() 吧。
4.2.1 LeakCanaryInternals # executeOnFileIoThread()
public static void executeOnFileIoThread(Runnable runnable) {
   fileIoExecutor.execute(runnable);
 }

private static final Executor fileIoExecutor = newSingleThreadExecutor("File-IO");

public static Executor newSingleThreadExecutor(String threadName) {
  return Executors.newSingleThreadExecutor(new LeakCanarySingleThreadFactory(threadName));
}
创建了一个 newSingleThreadExecutor 线程池,因为是 newSingleThreadExecutor 类型的 核心线程数目只有一个,所有任务在一个线程中执行的,所以可以用来进行阻塞式显示 DisplayLeakActivity 。 setEnabledBlocking() 肯定是在子线程中执行的
继续看 4.2.2 setEnabledBlocking()
4.2.2 LeakCanaryInternals # setEnabledBlocking()
public static void setEnabledBlocking(Context appContext, Class<?> componentClass, boolean enabled) {
  ComponentName component = new ComponentName(appContext, componentClass);
  PackageManager packageManager = appContext.getPackageManager();
  int newState = enabled ? COMPONENT_ENABLED_STATE_ENABLED : COMPONENT_ENABLED_STATE_DISABLED;
  // Blocks on IPC.
  packageManager.setComponentEnabledSetting(component, newState , DONT_KILL_APP);
}
通过前面 setEnabled(context, DisplayLeakActivity.class, true)我们可知
- componentClass 是 DisplayLeakActivity.class , setComponentEnabledSetting() 用于启用和禁用组件的相关代码,这里就是启用 DisplayLeakActivity 这个组件。
- enabled true 所以整个4.2 就是为了开启 DisplayLeakActivity 这个组件。它是用来显示泄漏界面的
接下来看 4.3 installOnIcsPlus()
4.3 ActivityRefWatcher # installOnIcsPlus()
public static void installOnIcsPlus(Application application, RefWatcher refWatcher) {
    if (SDK_INT < ICE_CREAM_SANDWICH) {
      // If you need to support Android < ICS, override onDestroy() in your base activity.
      return;
    }
    // 创建一个自己的 activityRefWatcher 实例
    ActivityRefWatcher activityRefWatcher = new ActivityRefWatcher(application, refWatcher);
    activityRefWatcher.watchActivities();
  }

  public void watchActivities() {
    // Make sure you don't get installed twice.
    stopWatchingActivities();
    //调用了 application 的 registerActivityLifecycleCallbacks() 方法
    application.registerActivityLifecycleCallbacks(lifecycleCallbacks);
  }
这里面创建了一个 ActivityRefWatcher 实例,然后执行了 watchActivities() ,其核心就是 application.registerActivityLifecycleCallbacks(), lifecycleCallbacks 实现了这个 ActivityLifecycleCallbacks ,并且重写了重 onActivityDestroyed() ,这样就能监听所有 Activity 执行完 onDestroyed() 方法 然后在里面 onActivityDestroyed() 中执行了 refWatcher.watch(activity) 进行内存泄漏的检测了。
这也是为啥要监听 Fragment 的话,就必须手动的在 Fragment 的 onDestory() 中执行,因为系统框架没有提供监听 Fragment 的 onDestory() 生命周期的方法。所以只能手动处理
private final Application.ActivityLifecycleCallbacks lifecycleCallbacks =
      new Application.ActivityLifecycleCallbacks() {
        ...
        @Override public void onActivityDestroyed(Activity activity) {
          ActivityRefWatcher.this.onActivityDestroyed(activity);
        }
      };

void onActivityDestroyed(Activity activity) {
   refWatcher.watch(activity);//关键代码
 }
在前面4.1 的 build() 中我们知道, refWatcher 其实是 RefWatcher 类型,所以就直接看 RefWatcher 的 watch() ,
注意 watch() 中传递的对象就是当前销毁的 Activity ,到这个时候,才开始监听这个 Activity 是否发生泄漏。
关键代码 RefWatcher # watch()
public void watch(Object watchedReference) {
  watch(watchedReference, "");
}
public void watch(Object watchedReference, String referenceName) {
  if (this == DISABLED) {
    return;
  }
  final long watchStartNanoTime = System.nanoTime();
  //使用随机的 UUID 保证了每个检测对象对应的 key 的唯一性
  String key = UUID.randomUUID().toString();
  //将生成的 key 添加到类型为 CopyOnWriteArraySet 的 Set 集合中
  retainedKeys.add(key);
  //新建了一个自定义的弱引用KeyedWeakReference
  final KeyedWeakReference reference = new KeyedWeakReference(watchedReference, key , referenceName , queue);
  ensureGoneAsync(watchStartNanoTime, reference);
}
使用随机的 UUID 保证了 key 的唯一。然后把这个 key 添加到 retainedKeys ,用来区分对象是否被回收 最后,根据传递过来的 Activity 对象, key , ReferenceQueue 类型的 queue , referenceName 等创建一个 KeyedWeakReference
KeyedWeakReference
final class KeyedWeakReference extends WeakReference<Object> {
  public final String key;
  public final String name;

  KeyedWeakReference(Object referent, String key , String name ,ReferenceQueue<Object> referenceQueue) {
    super(checkNotNull(referent, "referent"), checkNotNull(referenceQueue, "referenceQueue"));
    this.key = checkNotNull(key, "key");
    this.name = checkNotNull(name, "name");
  }
}
KeyedWeakReference 其实就是 WeakReference 的子类,保存了 key 和 name 用来标识了一个被检测的 WeakReference 对象,因为 name 是“”,所以生成的 key 很关键,这也是为啥 通过随机的 UUID 生成一个key
在 super() 将弱引用和引用队列 ReferenceQueue 关联起来,这样如果 这个弱引用对象 reference 持有的对象被回收后,就会把这个弱引用对象 reference 放入队列 ReferenceQueue 中。如果没有被回收,则不会放到队列中,所以可以通过判断 ReferenceQueue 这个队列中有没有 appleWeakReference 来确定有没有发生内存泄漏
继续看 ensureGoneAsync()
2. RefWatcher # ensureGoneAsync()
private void ensureGoneAsync(final long watchStartNanoTime, final KeyedWeakReference reference) {
   watchExecutor.execute(new Retryable() {
     @Override public Retryable.Result run() {
       return ensureGone(reference, watchStartNanoTime);
     }
   });
 }
watchExecutor 其实 是 AndroidWatchExecutor 实例,在4.1 build() 创建 RefWatcher 中初始化的。
2.1 AndroidWatchExecutor
public final class AndroidWatchExecutor implements WatchExecutor {

  static final String LEAK_CANARY_THREAD_NAME = "LeakCanary-Heap-Dump";
  private final Handler mainHandler;
  private final Handler backgroundHandler;
  private final long initialDelayMillis;
  private final long maxBackoffFactor;

  public AndroidWatchExecutor(long initialDelayMillis) {
    mainHandler = new Handler(Looper.getMainLooper());
    //使用 HandlerThread 的 looper 新建了一个backgroundHandler
    HandlerThread handlerThread = new HandlerThread(LEAK_CANARY_THREAD_NAME);
    handlerThread.start();
    backgroundHandler = new Handler(handlerThread.getLooper());
    this.initialDelayMillis = initialDelayMillis;
    maxBackoffFactor = Long.MAX_VALUE / initialDelayMillis;
  }

  @Override public void execute(Retryable retryable) {
    if (Looper.getMainLooper().getThread() == Thread.currentThread()) {
      waitForIdle(retryable, 0);
    } else {
      postWaitForIdle(retryable, 0);
    }
  }
}
根据当前线程是否是主线程,如果是,则直接调用 waitForIdle() 方法,如果不是,则调用 postWaitForIdle() ,
private void postWaitForIdle(final Retryable retryable, final int failedAttempts) {
   mainHandler.post(new Runnable() {
     @Override public void run() {
       waitForIdle(retryable, failedAttempts);
     }
   });
 }
不是主线程,则切换到当前线程。继续执行 waitForIdle
void waitForIdle(final Retryable retryable, final int failedAttempts) {
  // This needs to be called from the main thread.
  Looper.myQueue().addIdleHandler(new MessageQueue.IdleHandler() {
    @Override public boolean queueIdle() {
      postToBackgroundWithDelay(retryable, failedAttempts);
      return false;
    }
  });
}
当 looper 空闲的时候,会回调 queueIdle 方法,然后执行内部的 postToBackgroundWithDelay() 方法
private void postToBackgroundWithDelay(final Retryable retryable, final int failedAttempts) {
  long exponentialBackoffFactor = (long) Math.min(Math.pow(2, failedAttempts), maxBackoffFactor);
  //initialDelayMillis  默认 5 秒
  long delayMillis = initialDelayMillis * exponentialBackoffFactor;
  backgroundHandler.postDelayed(new Runnable() {
    @Override public void run() {
      Retryable.Result result = retryable.run();
      if (result == RETRY) {//递归调用
        postWaitForIdle(retryable, failedAttempts + 1);
      }
    }
  }, delayMillis);
}
创建一个 Retryable 对象,其实就是一个 Runnable 对象,然后判断是否在主线程,创建一个 IdelHandler ,执行这个 Retryable 对象,如果不是 主线程,则切换到主线程,然后创建 IdelHandler ,执行 run() 方法,每隔 5 秒就会遍历一次。 IdelHandler 就是只有在空闲的时候才会执行的 Handler 消息。并不会直接抢占资源。
如果 result 一直等于 RETRY 的话,则会一直执行 postWaitForIdle() 方法
2.2 RefWatcher # ensureGone()
Retryable.Result ensureGone(final KeyedWeakReference reference, final long watchStartNanoTime) {
  long gcStartNanoTime = System.nanoTime();
  long watchDurationMs = NANOSECONDS.toMillis(gcStartNanoTime - watchStartNanoTime);
  //从弱引用队列获取待分析对象
  removeWeaklyReachableReferences();

  if (debuggerControl.isDebuggerAttached()) {
    // 当 Android 设备处于 debug 状态时,会直接返回 RETRY 进行延时重试检测的操作
    return RETRY;
  }
  if (gone(reference)) {
    return DONE;
  }
  //执行了 gcTrigger 的 runGc() 方法进行垃圾回收
  gcTrigger.runGc();
  //移除已经被回收的引用
  removeWeaklyReachableReferences();
  //判断 activity 如果还没有被回收,则证明发生内存泄露
  if (!gone(reference)) {
    long startDumpHeap = System.nanoTime();
    long gcDurationMs = NANOSECONDS.toMillis(startDumpHeap - gcStartNanoTime);
    //先调用堆信息转储者 heapDumper 的 dumpHeap() 生成相应的 hprof 文件
    File heapDumpFile = heapDumper.dumpHeap();
    if (heapDumpFile == RETRY_LATER) {
      // Could not dump the heap.
      return RETRY;
    }
    long heapDumpDurationMs = NANOSECONDS.toMillis(System.nanoTime() - startDumpHeap);
    //会执行 heapdumpListener 的 analyze() 对新创建的 HeapDump 对象进行泄漏分析
    heapdumpListener.analyze(
        new HeapDump(heapDumpFile, reference.key, reference.name, excludedRefs , watchDurationMs ,
 gcDurationMs , heapDumpDurationMs));
  }
  return DONE;
}
2.2.1 RefWatcher # removeWeaklyReachableReferences()
移除已经被回收的引用
private void removeWeaklyReachableReferences() {
  KeyedWeakReference ref;
  while ((ref = (KeyedWeakReference) queue.poll()) != null) {
    retainedKeys .remove(ref.key);
  }
}
2.2.2 RefWatcher # gone()
判断 retainedKeys 集合中是否还含有 reference ,若没有,证明已经被回收了,若含有,可能已经发生内存泄露(或 Gc 还没有执行回收)。
private boolean gone(KeyedWeakReference reference) {
 return !retainedKeys.contains(reference.key);
 }
如果执行到了 gcTrigger.runGc();也就是说明可能发生了泄漏,需要执行一次 GC 试试 gcTrigger 也是在 4.1 build() 创建 RefWatcher 中创建的,如果没有指定则是 GcTrigger.DEFAULT
2.2.3 GcTrigger # runGc()
GcTrigger DEFAULT = new GcTrigger() {
    @Override public void runGc() {
      //手动触发系统gc
      Runtime.getRuntime().gc();
      //沉睡 100ms ,给系统 GC 时间
      enqueueReferences();
      //强制调用已失去引用对象的 finalize 方法
      System.runFinalization();
    }

    private void enqueueReferences() {
      try {
        Thread.sleep(100);
      } catch (InterruptedException e) {
        throw new AssertionError();
      }
    }
  };
没有使用System.gc()方法进行回收,因为system.gc()并不会每次都执行。而是从 AOSP 中拷贝一段 GC 回收的代码,从而相比System.gc()更能够保证进行垃圾回收的工作。
执行完 GC ,再次执行 gone() 进行判断,如果还存在,说明发送了内存泄漏。那就要生成相应的 dump 文件。
2.2.4 AndroidHeapDumper # dumpHeap()
public File dumpHeap() {
    //创建一个新的 dump 文件
    File heapDumpFile = leakDirectoryProvider.newHeapDumpFile();

    if (heapDumpFile == RETRY_LATER) {
      //这个文件等于 RETRY_LATER 则表示生成失败
      return RETRY_LATER;
    }

    FutureResult<Toast> waitingForToast = new FutureResult<>();
    //弹出自定义 toast ,
    showToast(waitingForToast);

    if (!waitingForToast.wait(5, SECONDS)) {
      CanaryLog.d("Did not dump heap, too much time waiting for Toast.");
      return RETRY_LATER;
    }

    Toast toast = waitingForToast.get();
    try {
      //调用了 Android SDK 的API Debug.dumpHprofData() 来生成 hprof 文件
      Debug.dumpHprofData(heapDumpFile.getAbsolutePath());
      cancelToast(toast);
      return heapDumpFile;
    } catch (Exception e) {
      CanaryLog.d(e, "Could not dump heap");
      // 等于 RETRY_LATER 则表示生成失败,直接返回 RETRY 进行延时重试检测的操作
      return RETRY_LATER;
    }
  }
showToast() 中弹出了自定义 toast ,自定义布局 就是 R.layout.leak_canary_heap_dump_toast
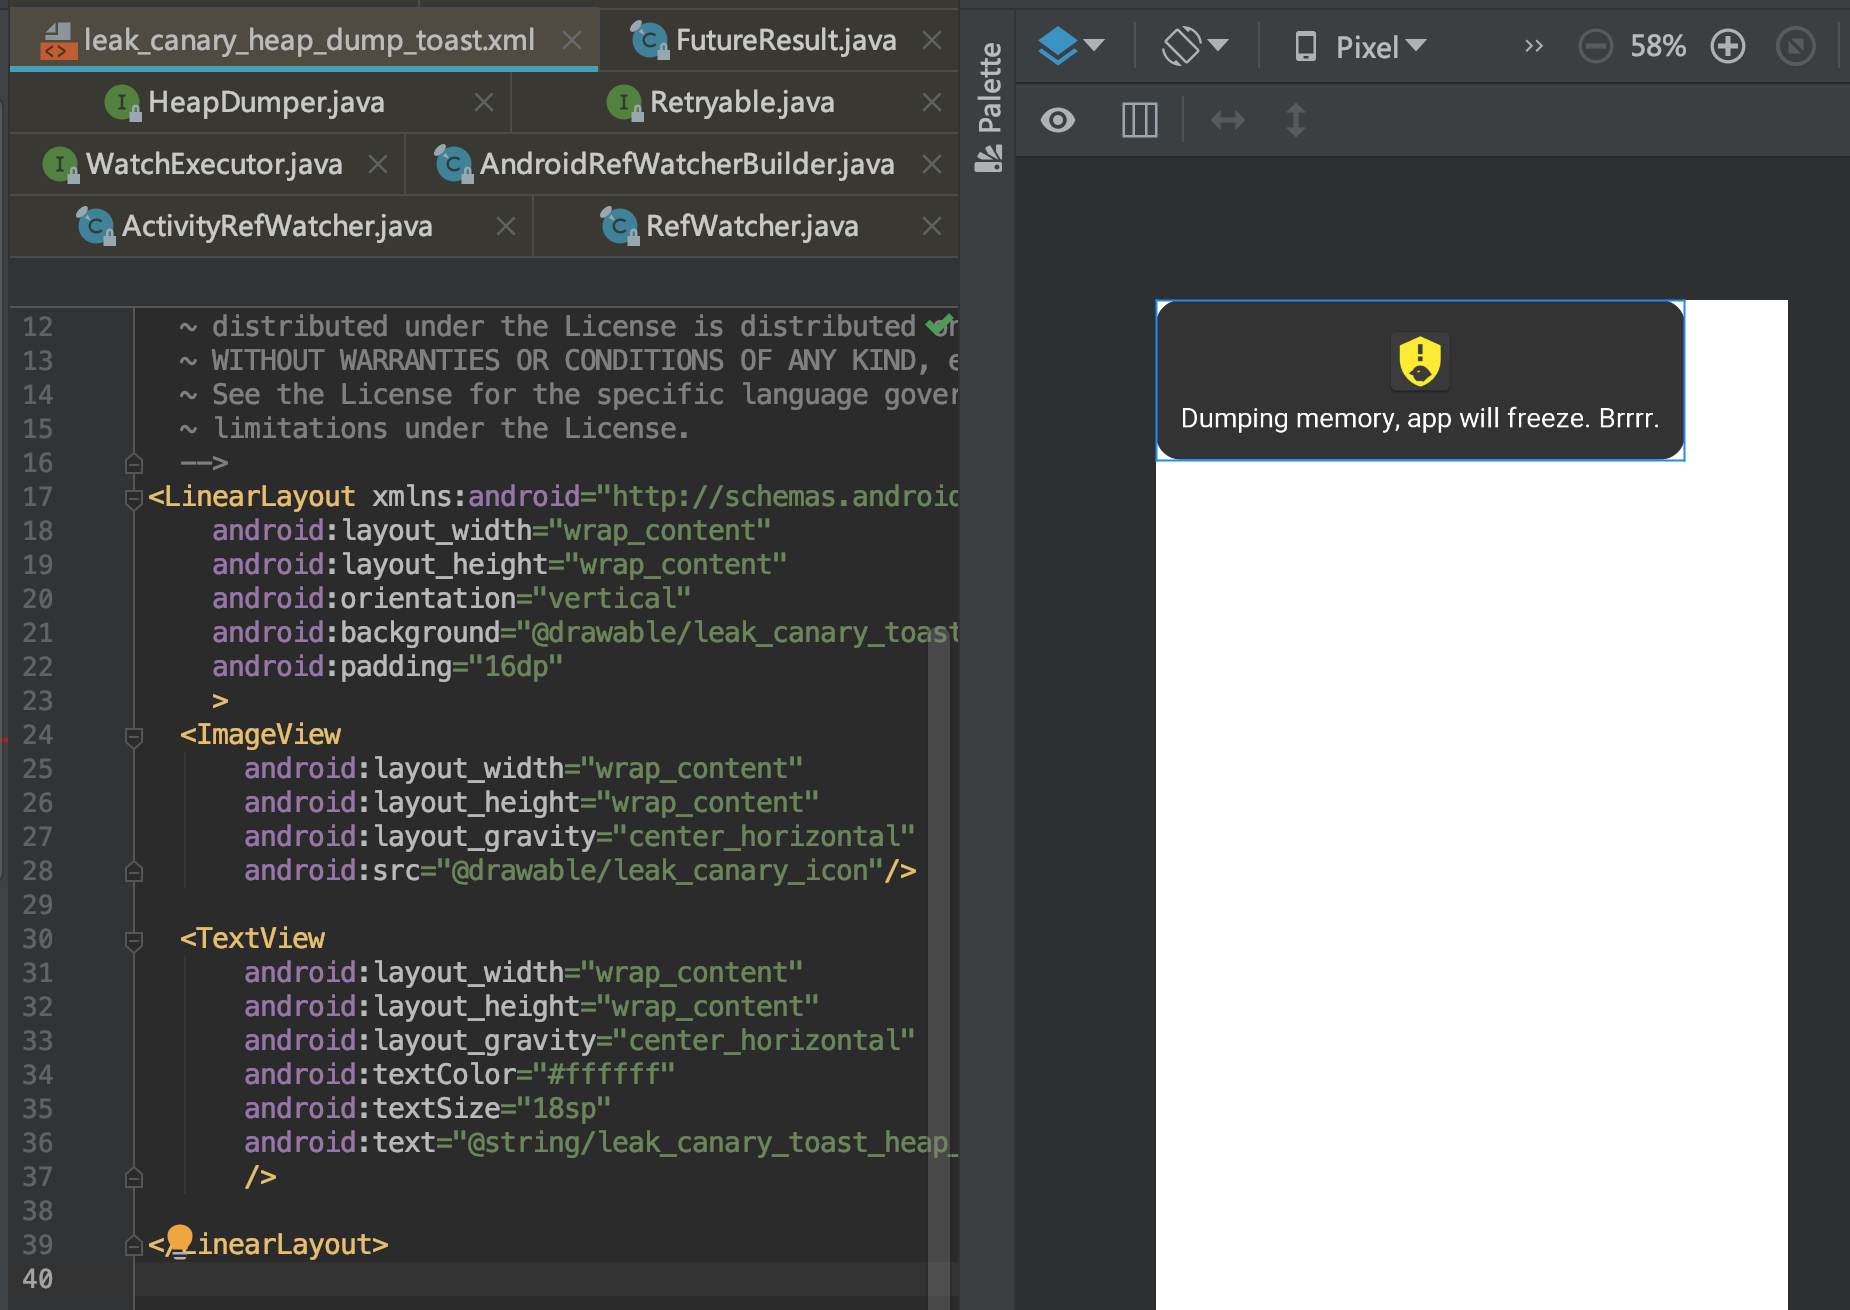 这个就是发生内存泄漏的时候,我们常看到的布局
最后 调用了 Android SDK 的API Debug.dumpHprofData() 来生成 hprof 文件
hprof 文件生成了,那就看看怎么分析这个文件吧。
heapdumpListener 是 HeapDump.Listener ,实际类型是 ServiceHeapDumpListener ,这个也在4.1 build()中设置了。
2.2.5 ServiceHeapDumpListener # analyze()
public void analyze(HeapDump heapDump) {
  HeapAnalyzerService.runAnalysis(context, heapDump , listenerServiceClass);
}
HeapAnalyzerService 是一个 IntentService ,就是为了避免减慢 app 进程或占用内存,
2.2.5.1 HeapAnalyzerService
public final class HeapAnalyzerService extends IntentService {

  private static final String LISTENER_CLASS_EXTRA = "listener_class_extra";
  private static final String HEAPDUMP_EXTRA = "heapdump_extra";

  public static void runAnalysis(Context context, HeapDump heapDump ,
      Class<? extends AbstractAnalysisResultService> listenerServiceClass) {
    Intent intent = new Intent(context, HeapAnalyzerService.class);
    intent.putExtra(LISTENER_CLASS_EXTRA, listenerServiceClass.getName());
    intent.putExtra(HEAPDUMP_EXTRA, heapDump);
    context.startService(intent);
  }

  public HeapAnalyzerService() {
    super(HeapAnalyzerService.class.getSimpleName());
  }

  protected void onHandleIntent(Intent intent) {
    if (intent == null) {
      CanaryLog.d("HeapAnalyzerService received a null intent, ignoring.");
      return;
    }
    String listenerClassName = intent.getStringExtra(LISTENER_CLASS_EXTRA);
    HeapDump heapDump = (HeapDump) intent.getSerializableExtra(HEAPDUMP_EXTRA);
    //新建一个 HeapAnalyzer 对象,它就是根据 RefWatcher 生成的 heap dumps 信息来分析被怀疑的泄漏是否是真的。
    HeapAnalyzer heapAnalyzer = new HeapAnalyzer(heapDump.excludedRefs);
    //checkForLeak()方法去使用 haha 库解析 hprof 文件
    AnalysisResult result = heapAnalyzer.checkForLeak(heapDump.heapDumpFile, heapDump.referenceKey);
    AbstractAnalysisResultService.sendResultToListener(this, listenerClassName , heapDump , result);
  }
}
runAnalysis 开启了 HeapAnalyzerService ,就会执行到了 onHandleIntent() 中,这个是在子线程中执行的 然后就执行到了 checkForLeak()
2.2.5.2 HeapAnalyzer # checkForLeak()
public AnalysisResult checkForLeak(File heapDumpFile, String referenceKey) {
    long analysisStartNanoTime = System.nanoTime();

    if (!heapDumpFile.exists()) {
      Exception exception = new IllegalArgumentException("File does not exist: " + heapDumpFile);
      return failure(exception, since(analysisStartNanoTime));
    }

    try {
      //新建一个内存映射缓存文件buffer
      HprofBuffer buffer = new MemoryMappedFileBuffer(heapDumpFile);
      //使用 buffer 新建一个 HprofParser 解析器去解析出对应的引用内存快照文件snapshot
      HprofParser parser = new HprofParser(buffer);
      Snapshot snapshot = parser.parse();
      //为了减少在Android 6.0版本中重复 GCRoots 带来的内存压力的影响,使用 deduplicateGcRoots() 删除了 gcRoots 中重复的根对象RootObj
      deduplicateGcRoots(snapshot);
      //调用了 findLeakingReference() 方法将传入的 referenceKey 和 snapshot 对象里面所有类实例的字段值对应的 keyCandidate 进行比较
      Instance leakingRef = findLeakingReference(referenceKey, snapshot);

      // 如果没有相等的,则表示没有发生内存泄漏
      if (leakingRef == null) {
        return noLeak(since(analysisStartNanoTime));
      }
      //返回一个有泄漏分析结果的 AnalysisResult 对象。
      return findLeakTrace(analysisStartNanoTime, snapshot , leakingRef);
    } catch (Throwable e) {
      return failure(e, since(analysisStartNanoTime));
    }
  }
关键代码都已经注释了,这里就不多解释,然后看看 AbstractAnalysisResultService.sendResultToListener()
这里 AbstractAnalysisResultService 的实现类就是我们刚开始分析的用于展示泄漏路径信息得 DisplayLeakService 对象
2.2.5.3 AbstractAnalysisResultService.sendResultToListener()
又开启了一个 IntentService ,这里面的 listenerServiceClass 其实就是在创建 ServiceHeapDumpListener 的时候传递过来的 DisplayLeakService ,
public abstract class AbstractAnalysisResultService extends IntentService {

public static void sendResultToListener(Context context, String listenerServiceClassName , HeapDump heapDump , AnalysisResult result) {
   Class<?> listenerServiceClass;
   try {
     listenerServiceClass = Class.forName(listenerServiceClassName);
   } catch (ClassNotFoundException e) {
     throw new RuntimeException(e);
   }
   Intent intent = new Intent(context, listenerServiceClass);
   intent.putExtra(HEAP_DUMP_EXTRA, heapDump);
   intent.putExtra(RESULT_EXTRA, result);
   context.startService(intent);
 }
}
开启 DisplayLeakService 这个 Service ,因为是一个 IntentService , 然后执行到了 onHandleIntent()
protected final void onHandleIntent(Intent intent) {
    HeapDump heapDump = (HeapDump) intent.getSerializableExtra(HEAP_DUMP_EXTRA);
    AnalysisResult result = (AnalysisResult) intent.getSerializableExtra(RESULT_EXTRA);
    try {
      onHeapAnalyzed(heapDump, result);
    } finally {
      //noinspection ResultOfMethodCallIgnored
      heapDump.heapDumpFile.delete();
    }
  }
在 onHandleIntent() 执行到了 onHeapAnalyzed() ,核心的里面直接创建一个由 PendingIntent 构建的泄漏通知用于供用户点击去展示详细的泄漏界面DisplayLeakActivity
public class DisplayLeakService extends AbstractAnalysisResultService {

  protected final void onHeapAnalyzed(HeapDump heapDump, AnalysisResult result) {
    String leakInfo = leakInfo(this, heapDump , result , true);

    boolean resultSaved = false;
    boolean shouldSaveResult = result.leakFound || result.failure != null;
    if (shouldSaveResult) {
      heapDump = renameHeapdump(heapDump);
      //分析的堆信息文件保存成功之后
      resultSaved = saveResult(heapDump, result);
    }

    PendingIntent pendingIntent;
    String contentTitle;
    String contentText;

    if (!shouldSaveResult) {
      contentTitle = getString(R.string.leak_canary_no_leak_title);
      contentText = getString(R.string.leak_canary_no_leak_text);
      pendingIntent = null;
    } else if (resultSaved) {
      //创建一个供用户点击跳转到 DisplayLeakActivity 的延时通知
      pendingIntent = DisplayLeakActivity.createPendingIntent(this, heapDump.referenceKey);
      ...
    }
    // New notification id every second.
    int notificationId = (int) (SystemClock.uptimeMillis() / 1000);
    showNotification(this, contentTitle , contentText , pendingIntent , notificationId);
    afterDefaultHandling(heapDump, result , leakInfo);
  }

}
这样就展示到了 UI 上了
搬运地址:
既已览卷至此,何不品评一二: